Ok more fun with graphs. And yes, an 11 second pass would be nice! One thing I’ve noticed is a “soft” shift in comparison to others. I believe it’s the smaller clutch pack (2, 4, and 6) whereas the larger (1, 3, 5 and 7) is snappy in comparison. So possible clutch wear on my end or even a possibly weak main pressure solenoid for that gear set. It’s not super obvious but I did notice the other day. Ben’s car is far younger, LOL. I’d like to swap in a more aggressive clutch pack and apparently, you only need to run adaptation at a few select mileage points to adjust to the additional friction capability.
But back to graphs!
Going to post a few from my last visit to the drag strip. The main difference is I’m NOT using a fan pack. Cliff notes version, it was pretty stable. Ambient temps were as high as 78 and for the most part, the ATF fluid stayed in the 70’s with the clutch temps often reaching 20 degrees higher before cooling down at the end of the run. I made sure to do two things. First, I went to the furthest exit at the end of the run so the car had more airflow for a longer period of time. The second thing I did was run the a/c fans for a bit to help mediate temps. With the fan pack, they kick on at about 80C so you never have to think about it. Now if I just had a tuner that could maybe link trans temps to fan speed…hmm. When the ATF temps hit 80C, maybe turn the fans on, like 20%. Should do the trick without turning the a/c on.
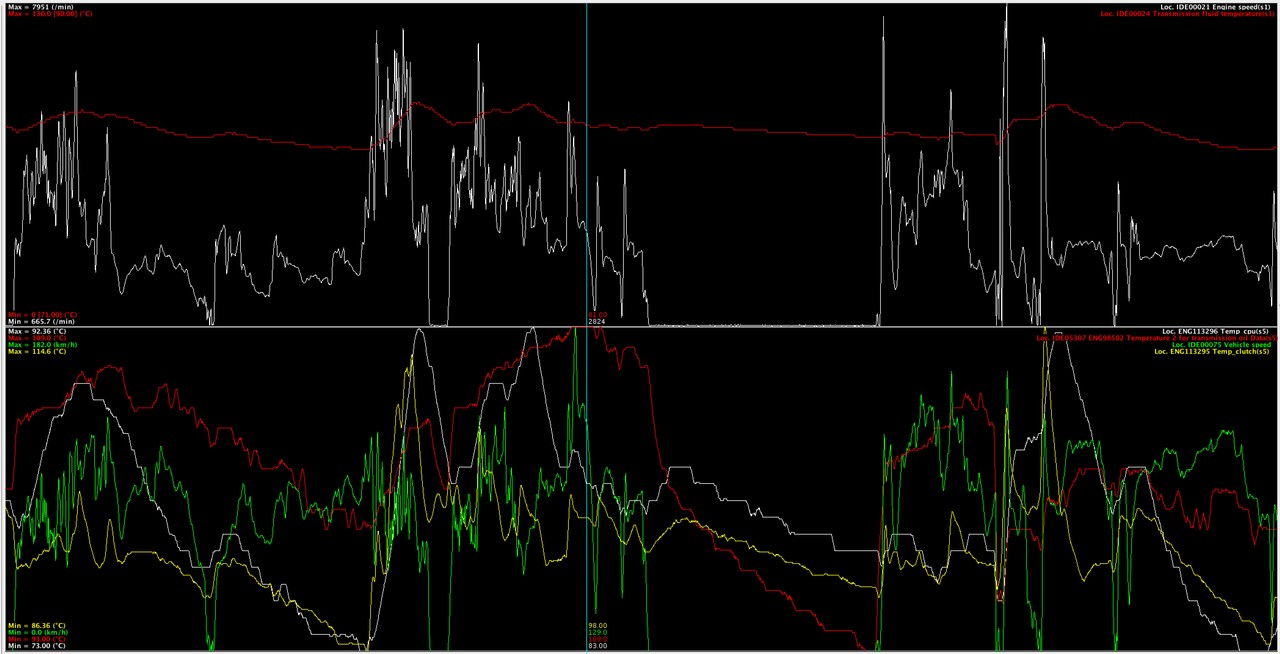
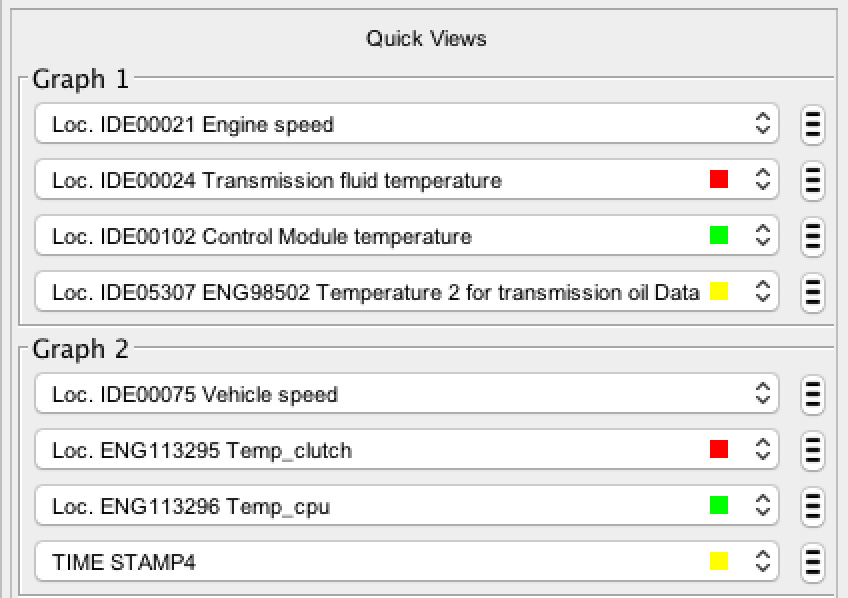
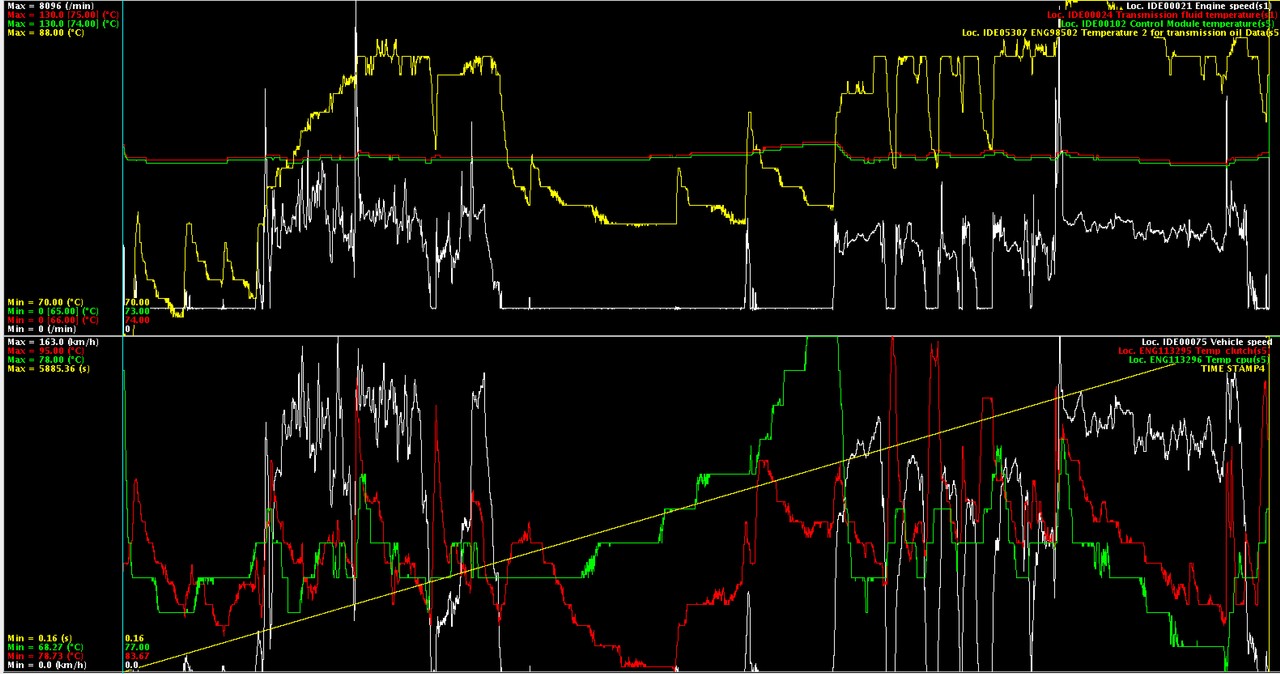
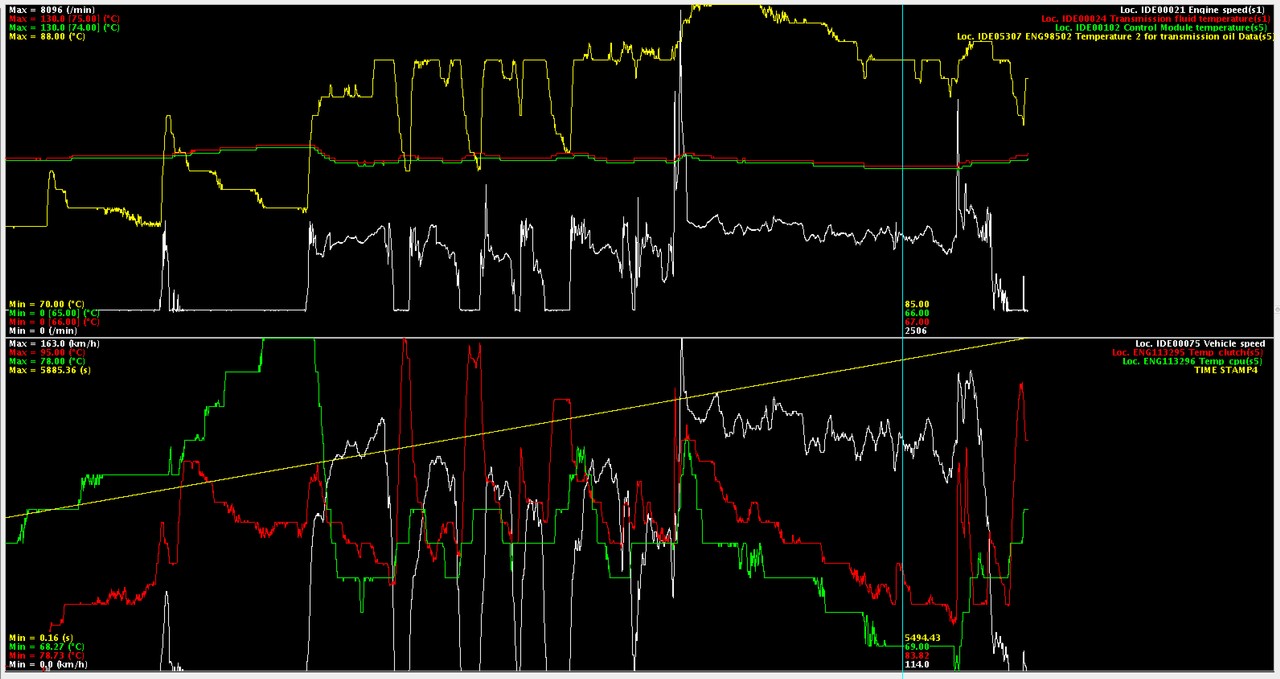
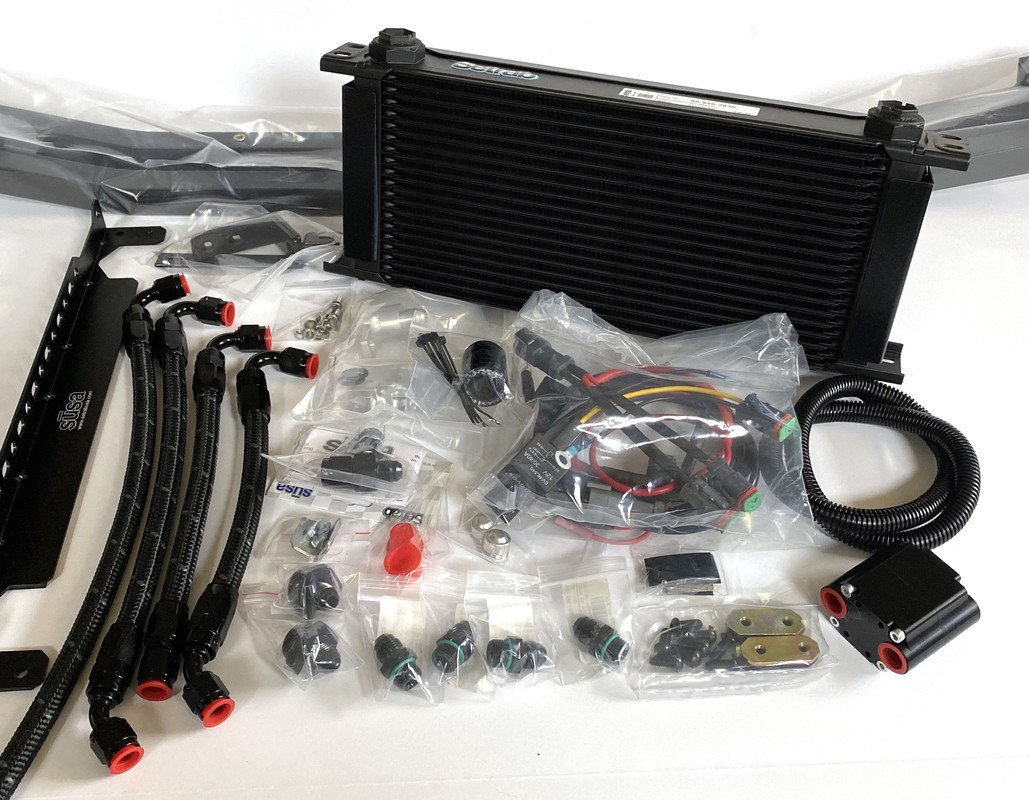
Some graphs. These are large but I’ve included the graph color chart on the left. Again, this is the RMR trans cooler kit WITHOUT a fan pack.
This one was labeled drag run 2 (made nine passes that day).
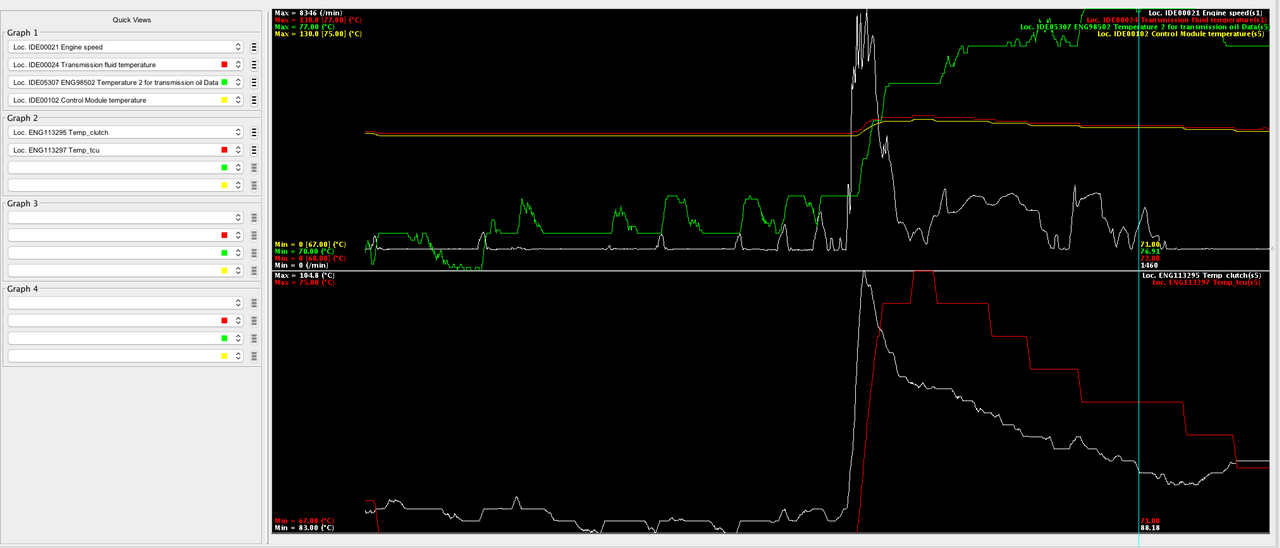
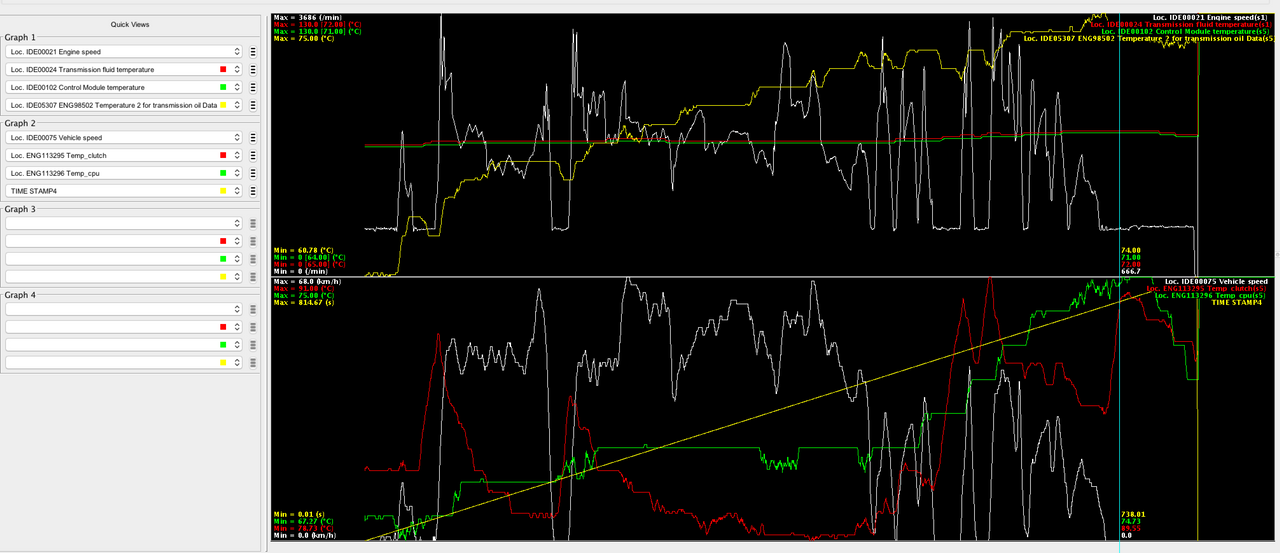
The thermostat generally stabilizes the temp at around 68-70C. I’ve started out at 71C (red/yellow line), sitting in the staging line. Max, at the end of the run is 77C and within seconds, it begins to cool down again. By the time I make it to the pits, it’s back down to 72 degrees. One note, not all the graphs are on the same axis. The green line is the manual transmission fluid on the gearbox side and it’s peak temp is also 77C but the way it’s graphed makes it look like it’s much hotter. It isn’t.
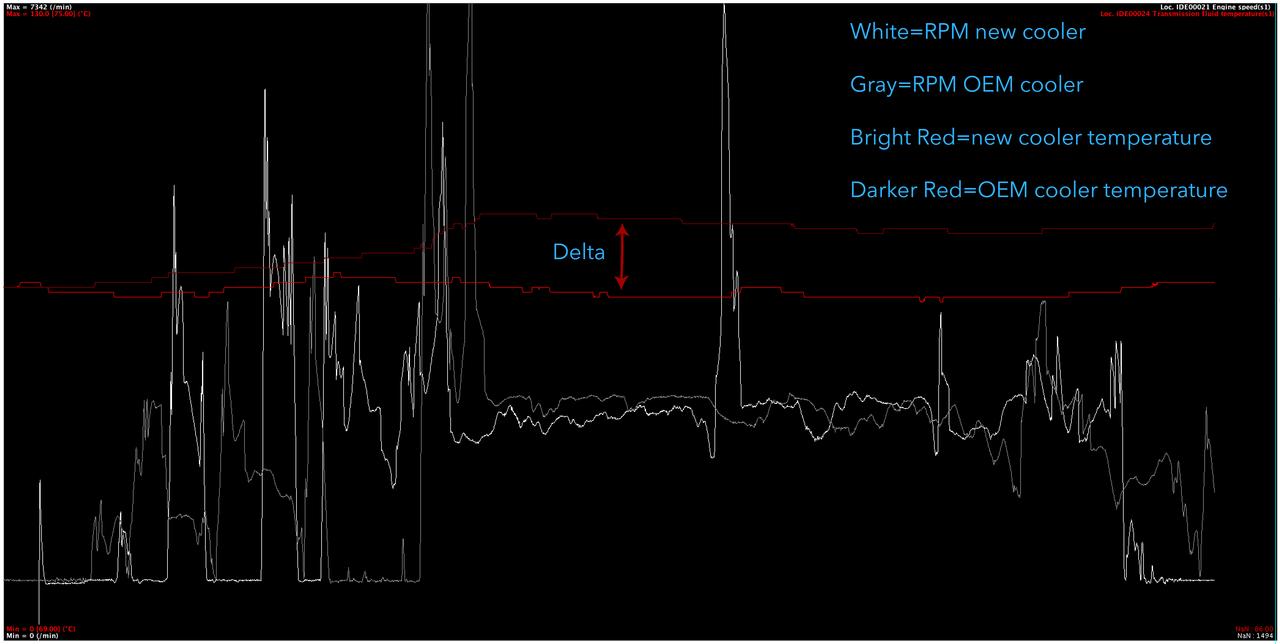
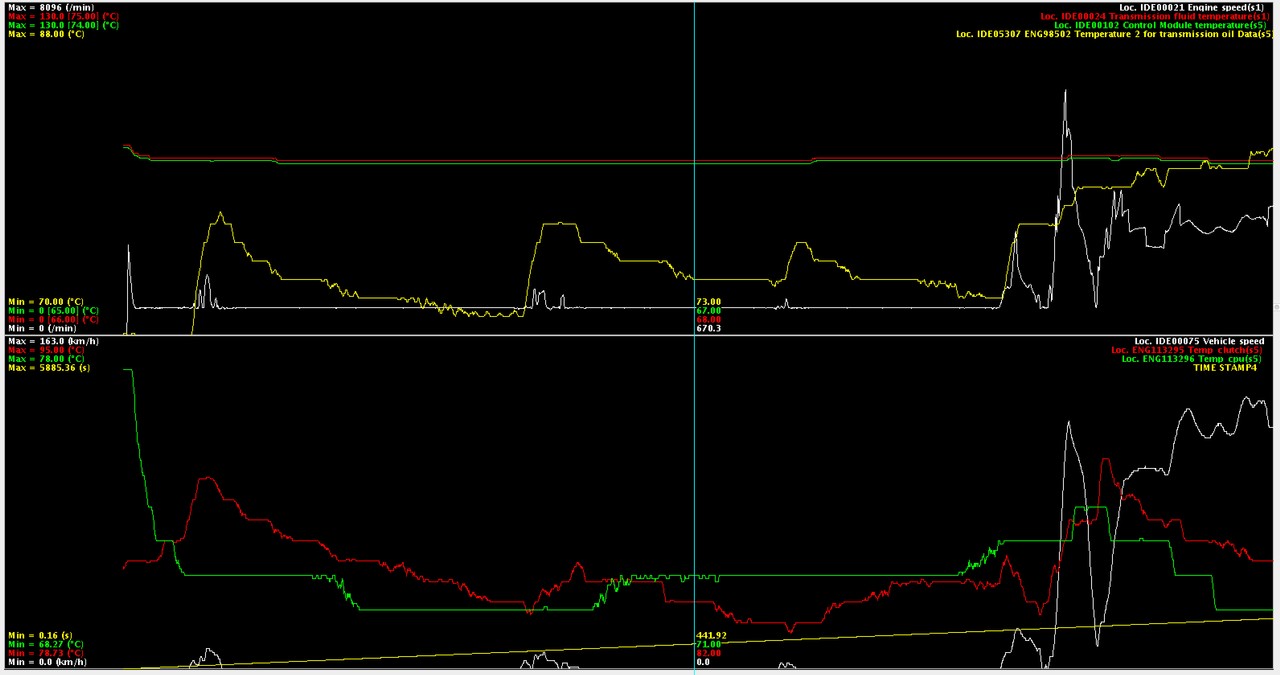
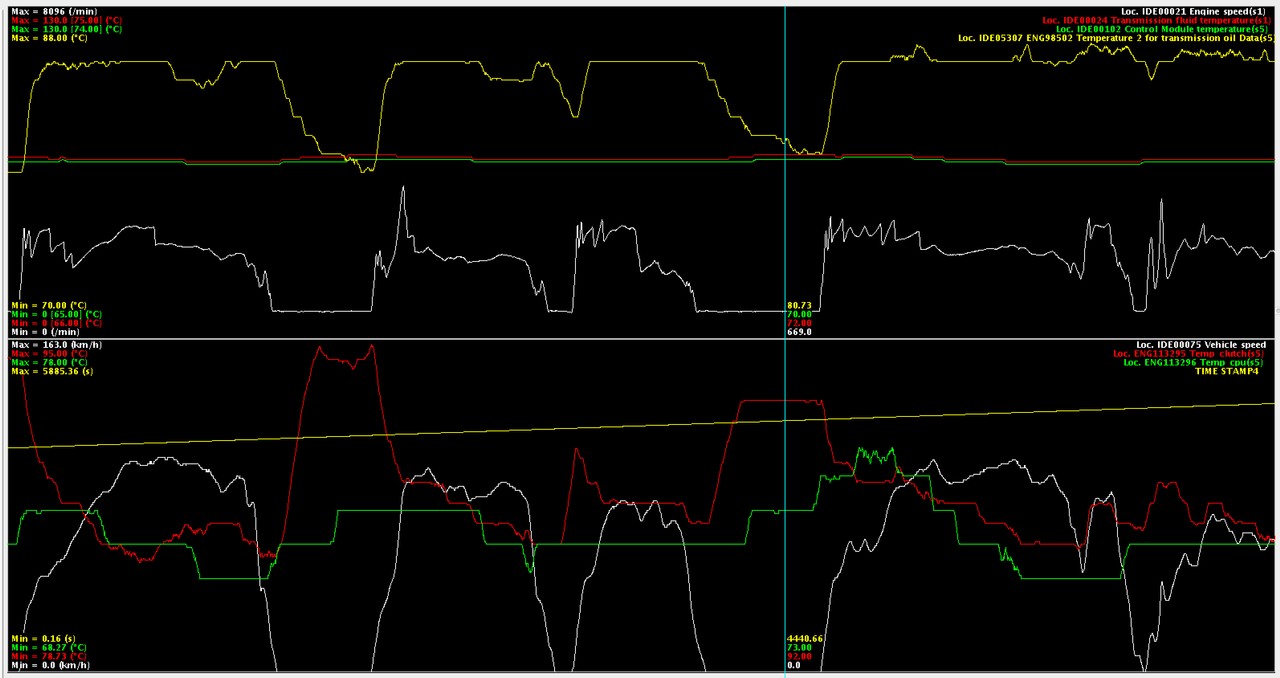
Here’s a closer view of the same drag run with more detail.
Now just imagine if you’re running the OEM cooler and it’s being “cooled” by 200 degree F (93C) coolant. The ATF fluid is already in the 90 degree range and the clutch would be 20 degrees hotter minimum. Not good!
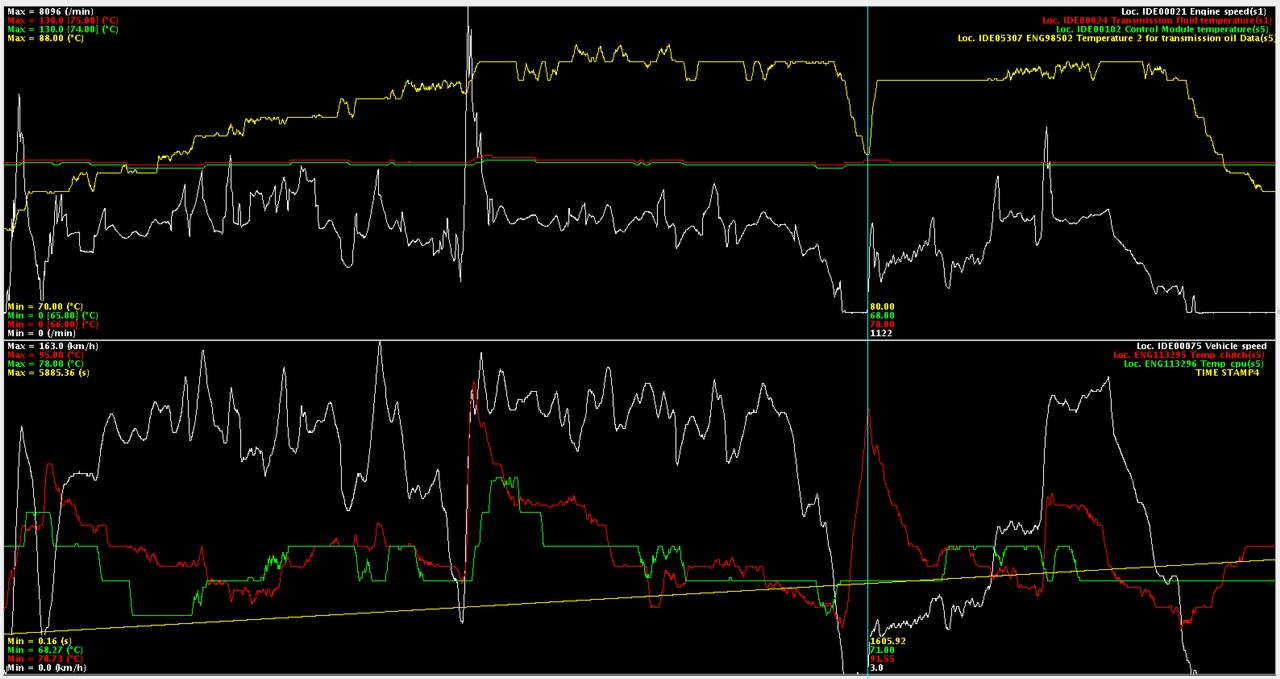
Here’s drag run six of the night. Temps stay pretty stable. This was at 4 or 5pm in the afternoon when ambient air temps were at their peak.
I did not make all runs back to back to back. Just impossible. Once you circle back around, there’s a line which varies in length so sometimes you get to run within 10 minutes, sometimes it’s a half hour wait. You then spend time idling with five or six cars in front of you (at best!) as you slowly creep up to the start line waiting for your turn to run. Not ideal but it is what it is.
So how bout city driving? I did an experiment on Thursday. Ambient temperatures were 72 degrees which, for my tests, is idea as it’s unlikely the fans will come on unless you’re idling for an extended period of time. The VCDS does not allow you to log fan speed AND transmission temperatures. I need to see if I can request that. So it’s one or the other.
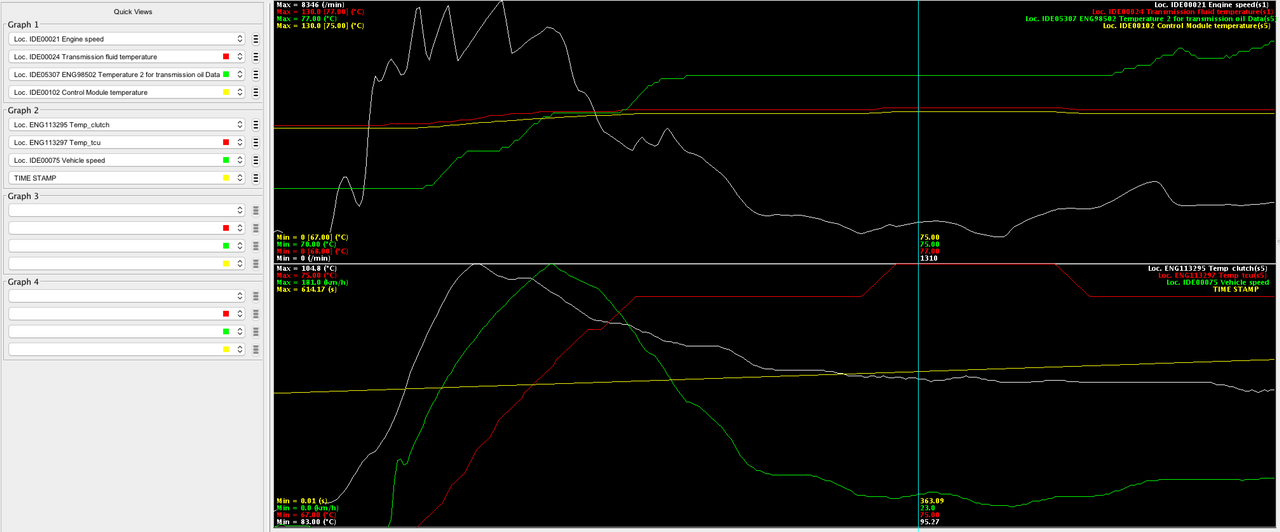
First graph is cold start and a drive downtown from my house. So same drive as the OEM cooler graph posted earlier. This time I threw in some city driving at the end though. The important part is after 900 seconds, the ATF temp with the RMR cooler is identical to the OEM cooler. So warmup time is exactly the same. And again, the gearbox temp graph is on another axis so it appears hotter but it’s peak temp is 65C.
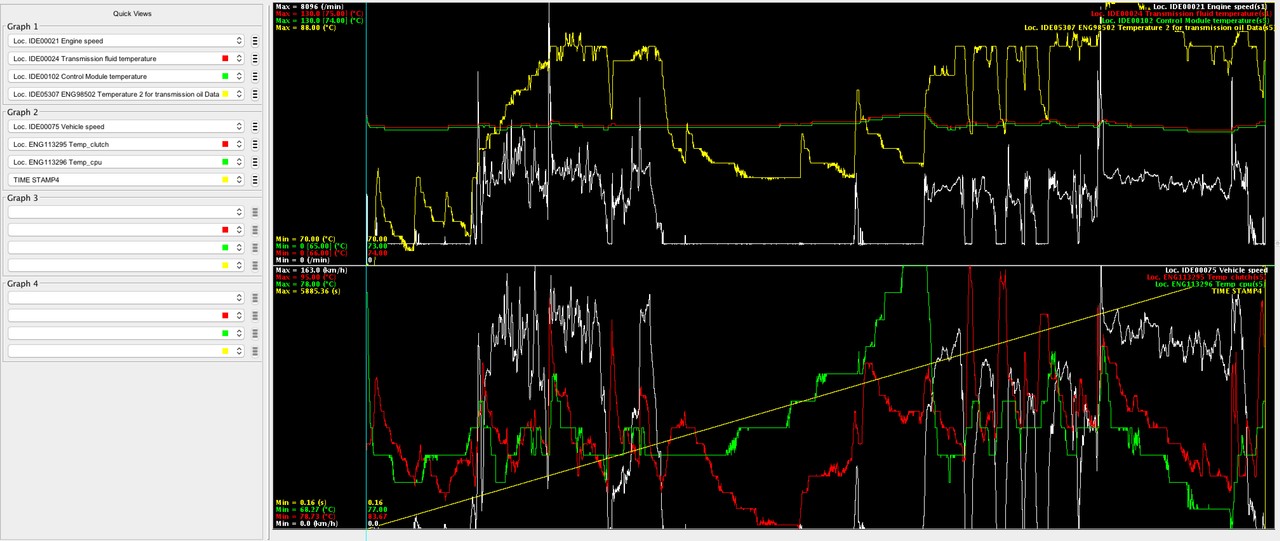
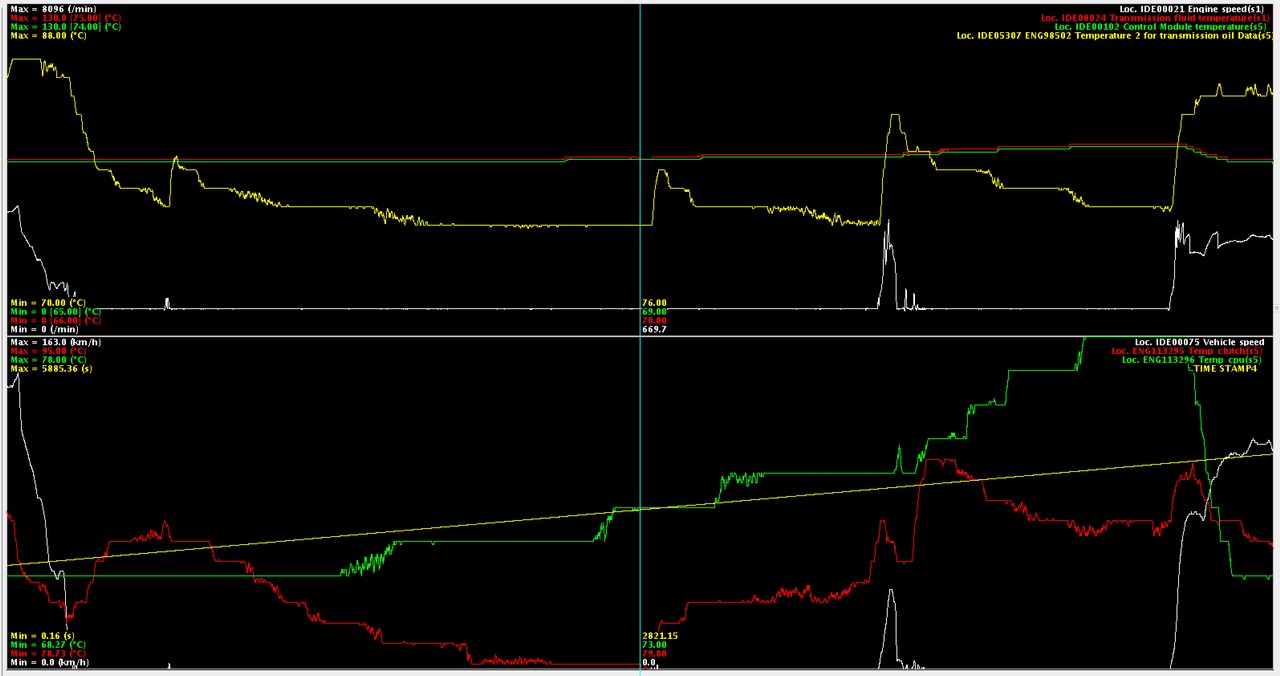
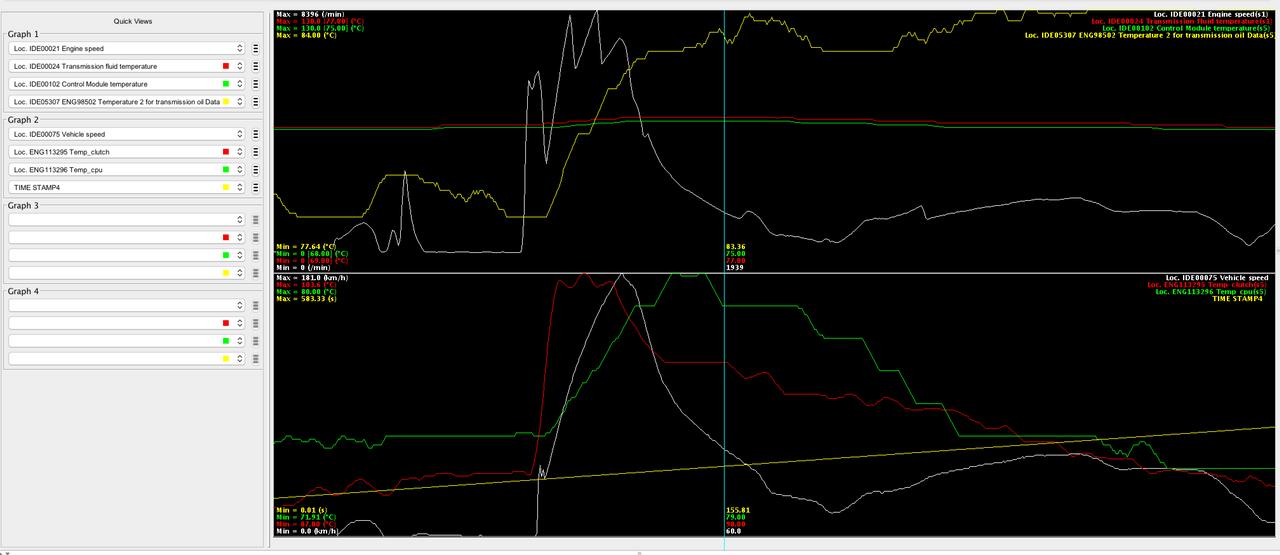
Torture test time…I logged from a hot start meaning I’d driven the car for a bit, it was warmed up, I began logging, then turned the car on. I drove around in the city, stoplight to stoplight with no issues. Temps stayed in the 70 degree range, no a/c fans on.
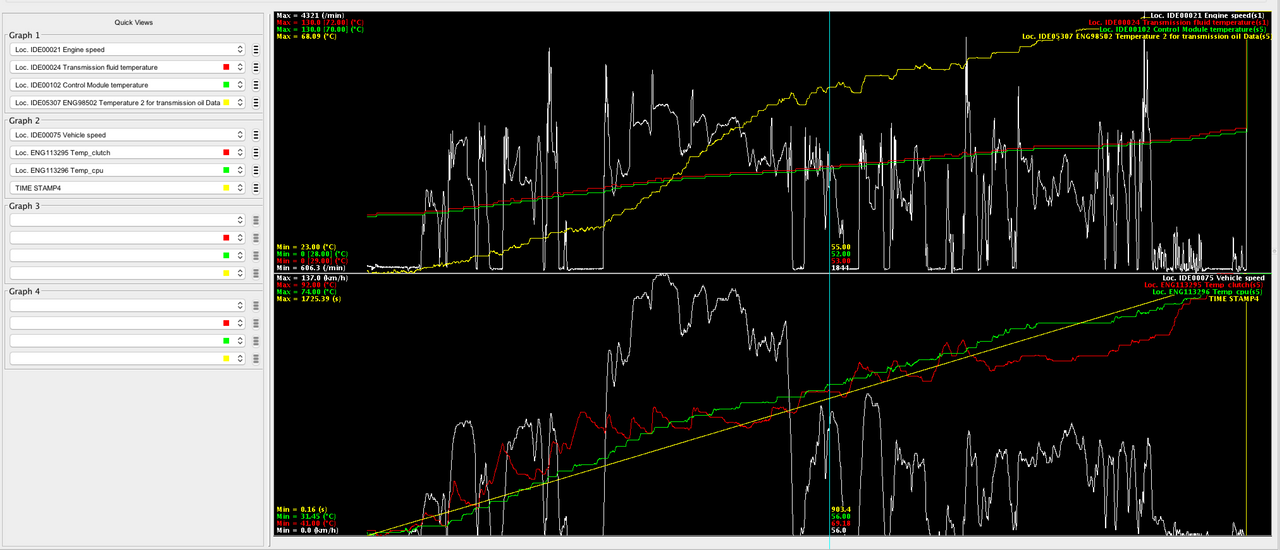
One really interesting aspect of the above graph is clutch temperature. The graph above is actually two graphs stacked on top of one and other. The bottom one, the red line is the clutch temp. See the spikes? Look at the white graph. That’s vehicle speed. Note the spikes come from when the car is stopped but in gear.
So far so good. I’ll continue testing but it looks like it’ll work as-is. I do believe, had I kept driving around, slowly, from stoplight to stoplight, the temps would have continued to rise into the 80C range but still damn safe and then some. Now if it’s moderately hot, you’ll probably turn the a/c on and the fans will kick in and the measured ATF temps will drop quickly.